What is Breakout Strategy?
Contents
Many people enjoy breakout strategy, but it is more difficult than it appears. This method looks for price areas that an asset cannot move beyond and waits for it to break through these levels, hence the approach’s name — breakout.
Breakouts may indicate where the price will go next, but in order to read the signals, traders must have analytical skills, practise, and a good understanding of how markets work. Traders frequently use technical analysis or chart patterns to identify potential breakouts. Let us take a closer look at this trading strategy.
What is the process of breakout trading?
In breakout trading, traders look for price chart support and resistance levels. These are critical support and resistance levels, which the price may retreat from or break through.
The levels are significant because they serve as a springboard: if the price eventually breaks through the support or resistance level, this may be interpreted as a signal that the price will continue to move in the same direction, presenting potential opportunities.
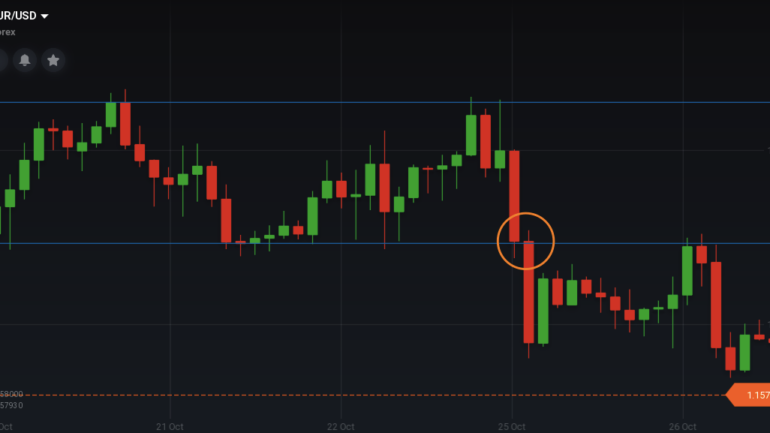
Depending on the direction of the breakout, a breakout may indicate a buying or selling opportunity. In the example below, the EUR/USD Forex chart broke through the resistance level downwards, signalling the end of a week-long consolidation with a bearish trend.

When the price breaks through the support level and continues to move downward, it may be interpreted as a “Sell” signal. At the same time, if the price breaks through the resistance level and continues to rise, this could be a “Buy” signal. It is important to note, however, that there is never a 100 percent guarantee of the accuracy of the results.
It is important to note that many traders who use this strategy do not enter the market right after the breakout, but rather wait for a retracement. This may help to avoid receiving a false signal, also known as a “fakeout,” in which the price returns to its previous level after a breakout or even begins moving in the opposite direction.
Top 3 methods for confirming a breakout

Making use of chart patterns
Chart patterns are frequently used to detect potential breakouts. When the price moves in a certain way, shapes like the triangle, rectangles, flags, head and shoulders, and the wedge pattern can all form. A trader establishes the support and resistance levels, and when the price breaks out of the candlestick pattern, a breakout is confirmed.
Making use of technical indicators
Technical indicators can be used to confirm a security’s breakout. MACD, Bollinger Bands, and RSI are three popular tools. Volume indicators may also be useful, as a breakout is frequently preceded by a period of low volume. Following a breakout, there is typically a surge in volume as the market enters a new active phase. However, using several indicators that complement each other may help you get a more accurate signal.
Making use of fundamentals
A company’s earnings report is an example of fundamental data that can be used to determine breakouts. When the company performs significantly better (or significantly worse) than expected, the price may rise or fall depending on the news. The hardest part of this approach is catching the right moment, so it requires a well-prepared risk management plan to go along with it.
Money management and breakout trading
Along with the breakout approach, there are several important risk management rules to follow. Traders who want to stick with this trading style should confirm the following:
- Stop-loss and take-profit levels that are appropriate. Make sure you know what you want to achieve with your trade before you set these. Stop-loss and take-profit limits must be set in accordance with the trading plan in order to avoid excessive risk and exit the trade on time.
- Several assets to keep track of. Finding a market that may be on the verge of a breakout isn’t always easy, so examining multiple charts at the same time can save traders time while also providing potential opportunities to work with.
- Patience and sound trading psychology are required. Trading breakouts is a difficult task, so allowing emotions to take the wheel is risky. It may be preferable to miss an entry than to make a costly error, so always check in with your emotions.
In conclusion
Breakout trading may be an approach that traders wish to employ in conjunction with chart patterns, technical indicators, or economic news. This method may provide traders with signals to enter the market, but it, like any trading strategy, requires practise and risk management. You can practise defining support and resistance levels on the Practice account to gain a better understanding of the breakout strategy, but remember to keep the risk management tips described above in mind!
How to Join VIP Trading Official’s VIP Signal Group?


